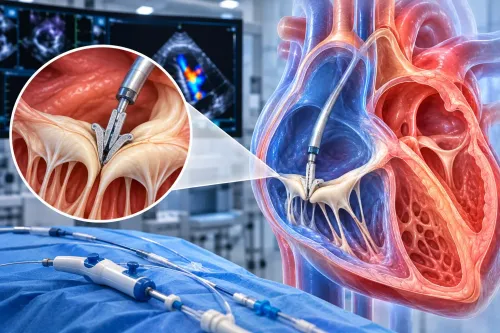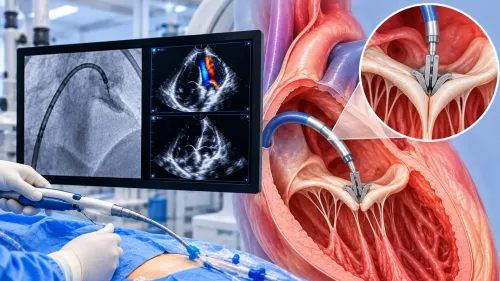
An abnormal rhythm can disappear before a routine test captures it, leaving you with symptoms but no clear electrical source. A 3D electrophysiology study places recording and pacing catheters inside the heart, then uses timing and position data to identify how the rhythm begins and spreads. By the end, you will understand what the map shows, when the study is useful, what you experience, and how it may guide ablation.
Key takeaways
- Electrode catheters record timing and location of electrical signals inside the heart.
- A 3D map identifies where an abnormal rhythm starts and how it spreads.
- EP studies help evaluate unexplained palpitations, tachycardia, and suspected arrhythmias.
- Mapping lets the electrophysiologist target ablation while limiting treatment to abnormal tissue.
What a 3D electrophysiology study actually measures
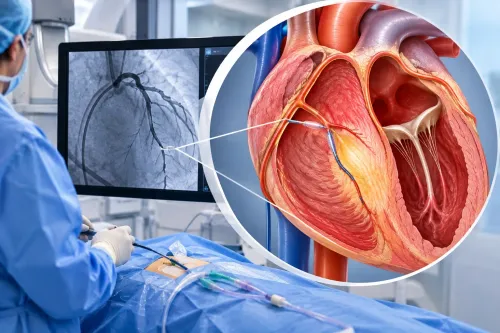
An invasive 3D electrophysiology study places thin electrode catheters, usually through a vein in the groin, inside the heart. The electrodes record intracardiac electrical signals from multiple sites while the system logs each catheter’s location and the timing of each heartbeat.
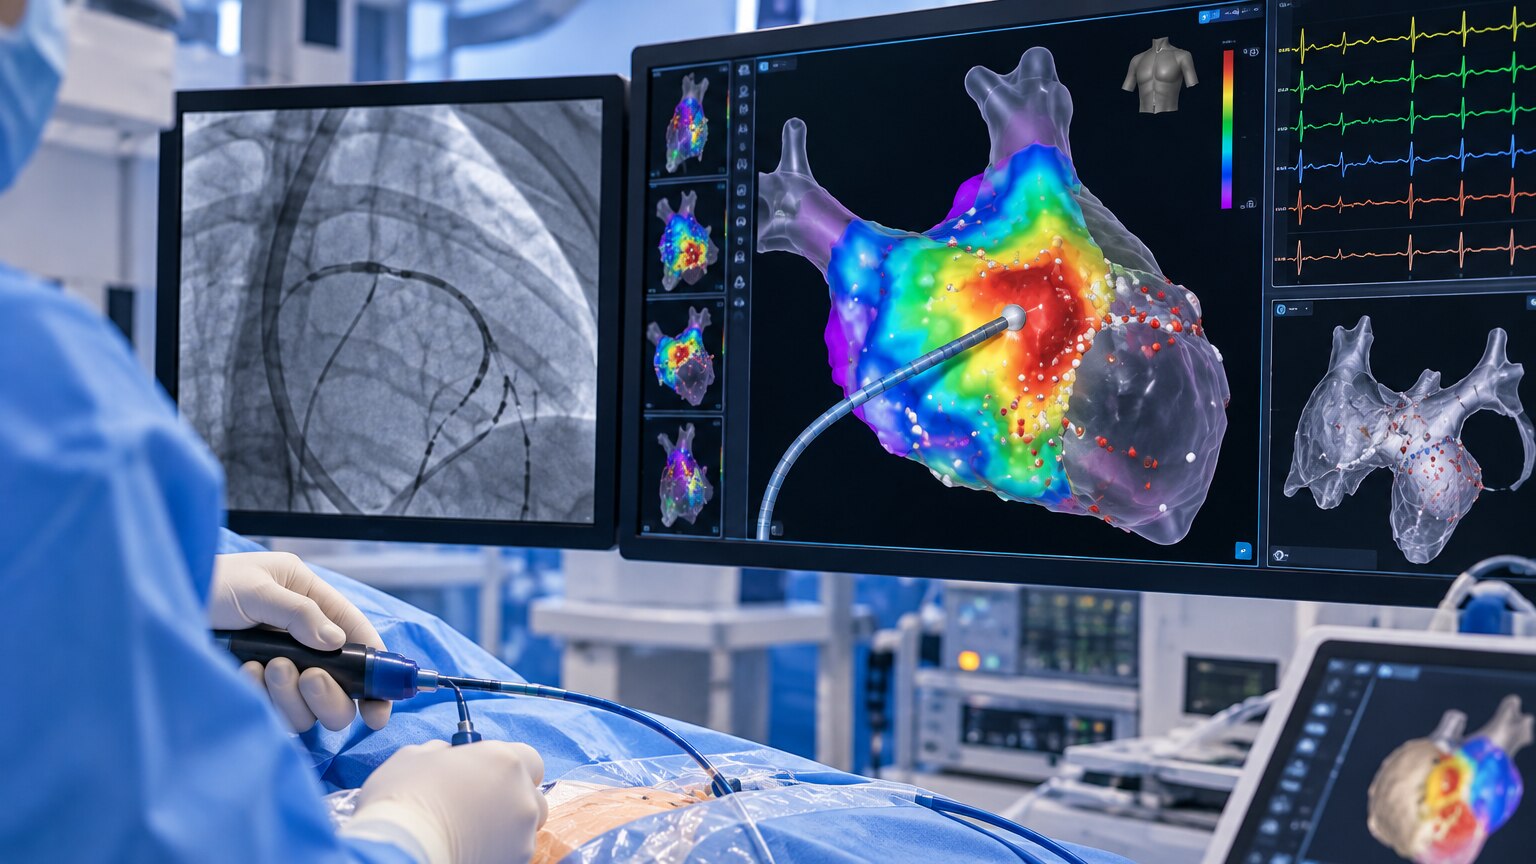
Software combines these data into a three-dimensional electroanatomic map showing where activation starts, how it travels, and how strong each recorded signal is.
| Test | What it measures | Main limitation |
|---|---|---|
| 3D electrophysiology study | Local electrical timing, signal voltage and catheter position inside the heart | Requires invasive catheter placement; the map depends on stable contact and reliable signals |
| 12-lead ECG | The heart’s electrical activity from skin electrodes during seconds of recording | Shows the combined surface signal, not the exact intracardiac location |
| Holter monitor | Surface ECG continuously during daily activity, usually over an extended recording period | Captures episodes outside the hospital but cannot record inside-heart signals |
| Echocardiogram | Heart structure, pumping, valves and blood flow using ultrasound | Shows mechanics and anatomy, not the electrical pathway causing an arrhythmia |
| Fluoroscopy | Two-dimensional X-ray images of catheter and body position | Shows where an object is, not the electrical timing or rhythm mechanism |
A three-dimensional electroanatomic map is not a 3D scan and does not directly show scar like cardiac MRI. Poor contact, breathing, motion, far-field signals or too few sampling points can create misleading data, so the operator reviews the raw electrograms and confirms questionable areas with additional mapping or pacing.
How the map reveals the rhythm’s source
The true source is not simply the brightest or largest area on the display. The system compares each catheter signal with a reference heartbeat, showing where the wave begins, how it spreads, and where conduction slows, blocks or disappears.
Doctors then test whether the earliest signal is the origin itself, a nearby exit site, or a bystander recording an electrically active area that is not driving the rhythm.
- An activation map marks the order in which sites depolarise. During a focal tachycardia or premature beat, the earliest consistent activation is a candidate origin; a wave that arrives later is unlikely to be the trigger.
- A voltage map measures signal strength. Low voltage can indicate scarred or diseased tissue that supports slow conduction, but poor catheter contact, electrode spacing, wavefront direction and the current rhythm can create a false low-voltage area.
- A pace map compares a heartbeat produced by pacing at a suspected site with the patient’s abnormal heartbeat. A close waveform match supports that location as the focus, even when the largest abnormal region lies elsewhere.
- An entrainment map tests a suspected re-entry circuit by pacing slightly faster than the rhythm. The timing response shows whether the catheter lies inside the circuit, near its critical pathway, or outside it.
No single map proves the diagnosis. Sedation, autonomic changes and pacing conditions can shift the apparent source, while a signal from diseased tissue can be a bystander rather than the mechanism sustaining the arrhythmia.
Which rhythm problems justify an EP study
An EP study is appropriate when palpitations, fainting, or documented rapid beats remain unexplained after an ECG, Holter monitor, event recorder, or other monitoring. It is especially useful when the tracing shows a fast rhythm but cannot distinguish the circuit or its starting point.
| Rhythm problem | What the EP study can clarify | When it is useful |
|---|---|---|
| Supraventricular tachycardia | AV nodal re-entrant tachycardia, AV re-entrant tachycardia, or atrial tachycardia | Recurrent episodes with an unclear mechanism or a possible ablation target |
| Atrial flutter | The flutter circuit and its critical conduction pathway | A persistent or recurrent rhythm that is not fully defined by surface ECG |
| Atrial fibrillation | Trigger patterns and pulmonary-vein electrical activity | Selected patients when treatment planning requires invasive mapping; it is not usually one removable point source |
| Ventricular tachycardia | The origin, scar-related circuit, or diseased ventricular tissue | Sustained or concerning episodes, especially with structural heart disease |
| Unexplained fainting | Whether a dangerous rhythm can be triggered | Syncope remains suspicious for arrhythmia after non-invasive testing |
Doctors can provoke the rhythm with programmed electrical stimulation, pacing, or isoproterenol while continuously monitoring blood pressure, oxygen level, and the ECG. They increase stimulation in controlled steps and stop if the rhythm becomes unsafe. If the arrhythmia cannot be induced, the study may still provide information but may not reveal a target for ablation.
Dr. Rajesh Matta can help interpret prior ECG and monitoring records when deciding whether an invasive study adds information.
What happens during the procedure and what you feel
You will usually arrive having fasted for the period in your instructions, often six to eight hours. Take or stop medicines only as directed; antiarrhythmics, diabetes medicines and blood thinners need individual instructions. Arrange someone to take you home if sedation is planned.
1. You change into a gown, have an intravenous line placed, and meet the electrophysiology team. Monitoring records your heart rhythm, blood pressure and oxygen level throughout the study.
2. After cleaning the groin, the doctor gives a local anaesthetic. You may feel a brief sting and pressure as the sheath enters the vein. Thin catheters are then advanced through femoral vein access into the heart; catheter movement usually feels like pressure rather than sharp pain.
3. Sedation can make you relaxed and sleepy, but you may remain awake enough to follow instructions. You must keep your body still while the catheters record signals and the mapping system tracks their positions.
4. The team may use pacing and programmed electrical stimulation to test how your heart conducts signals. They may give isoproterenol or another medicine to provoke the suspected rhythm. You could feel skipped beats, pounding or a sudden run of rapid beats; tell the team if you feel chest pain, severe breathlessness or distress.
5. Once recording and mapping finish, the catheters come out. Firm pressure over each groin site controls bleeding, followed by a dressing. Keep the leg still for the period instructed, and report increasing pain, swelling or bleeding.
How mapping guides ablation and recovery
Once the map identifies a reproducible source or circuit, the doctor positions the treatment catheter there and checks that the target is safe to treat. Mapping and treatment remain separate decisions: the procedure can end without ablation, or ablation can stop if the rhythm cannot be reproduced or the target is uncertain.
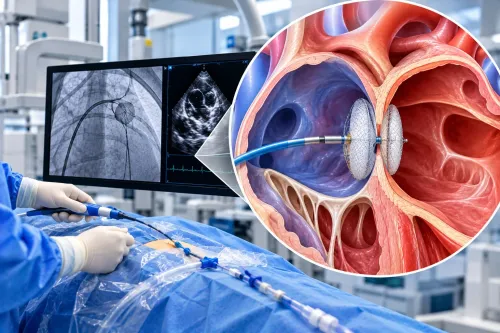
Radiofrequency ablation heats a small area to create a scar that blocks abnormal conduction. Cryothermal treatment freezes tissue; cryoballoon ablation uses a balloon to isolate the pulmonary veins, the usual strategy for atrial fibrillation rather than removing one stable point source.
Both methods can require repeat treatment if conduction recovers, another focus appears, or the original lesion set was incomplete.
Possible complications include:
- Groin bleeding, bruising, or a blood-vessel injury
- Cardiac perforation and pericardial tamponade
- Stroke or another clot-related event
- Damage to the normal conduction system, sometimes requiring a pacemaker
- Narrowing of a pulmonary vein after certain atrial fibrillation procedures
After catheter removal, expect pressure on the groin and observation for several hours or overnight, depending on the procedure and your condition. Recovery after EP study includes keeping the access site clean, avoiding heavy lifting until instructed, and reporting increasing swelling, chest pain, breathlessness, fainting, fever, or persistent rapid heartbeat.
Do not drive until sedation has cleared and your team permits it. Desk work often resumes sooner than physical work; return to exercise only after the access site is secure and your clinician sets the timeline. Recurrence is possible, so new palpitations require review rather than self-diagnosis.
Frequently asked questions
What does a 3D electrophysiology study measure?
It records intracardiac electrical signals from multiple heart sites while tracking catheter location and heartbeat timing.
How does 3D mapping locate an abnormal rhythm?
The system combines electrical timing with catheter position to show where the rhythm begins and how it travels through the heart.
Which rhythm problems may justify an EP study?
An EP study can evaluate unexplained palpitations, rapid heart rhythms, recurrent tachycardia, fainting linked to suspected arrhythmia, and rhythms being considered for ablation.
What happens during a 3D electrophysiology study?
The team numbs the groin, advances electrode catheters through a vein, records signals inside the heart, and may test or trigger the rhythm under controlled conditions.
How does mapping guide ablation and recovery?
The map identifies target tissue for ablation. Afterward, you are monitored for bleeding, rhythm changes, and other complications before discharge instructions and follow-up are provided.